Combining Machine Learning and Remote-sensing to predict Community-level Poverty in Bolivia
Combining Machine Learning and Remote-sensing to predict Community-level Poverty in Bolivia
In the vast tapestry of Bolivia’s evolving socioeconomic landscape, understanding the dynamics of poverty at the community level is of paramount importance. To decipher the threads of change that weave through these communities, I have developed a methodology (click here to download working paper) that combines machine learning and remote sensing. The objective? To forecast the poverty headcount ratio for the year 2022 and draw comparisons with the state of affairs in 2012 at the community level.
Unveiling the Methodology: A Meld of Data and Technology
The journey begins with the meticulous assembly of data from the 2012 Census, serving as the bedrock for constructing a poverty indicator based on Unsatisfied Basic Needs (UBN) at the community level. With 953 communities, each boasting a population exceeding 500 inhabitants, as the units of observation, the study takes a deep dive into the world of remote sensing. Here, data drawn from sources like nighttime luminosity, urban areas, road density, and power grids intersect with human-made markers like banks, schools, and hospitals, among others.
The heartbeat of this research is machine learning algorithms, which are nurtured with Census and remote-sensed data for training and validation. The ultimate goal? To predict the UBN poverty headcount ratio for both 2012 and forecast it for 2022. This fusion of predictive prowess and the vast potential of remote sensing heralds an innovative lens through which we can witness the evolution of community-level poverty in Bolivia.
The Power of Machine Learning: Key Insights
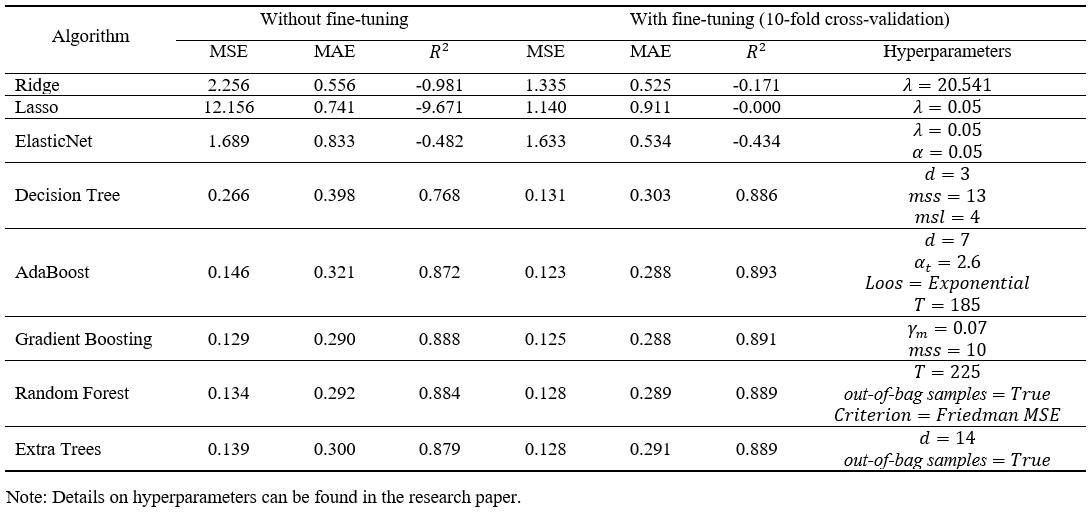
The study begins by fine-tuning eight machine learning algorithms using a 10-fold cross-validation approach. What emerges is that algorithms capturing non-linear relationships between the poverty headcount ratio and its predictors outshine those focusing on linear associations. In this category, stars include AdaBoost, Gradient Boosting, Random Forest, and Extra Trees. This optimization process isn’t just a technical exercise; it enhances the predictive and generalization capabilities of these models (Figure 1).
Remote Sensing’s Role in Poverty Prediction
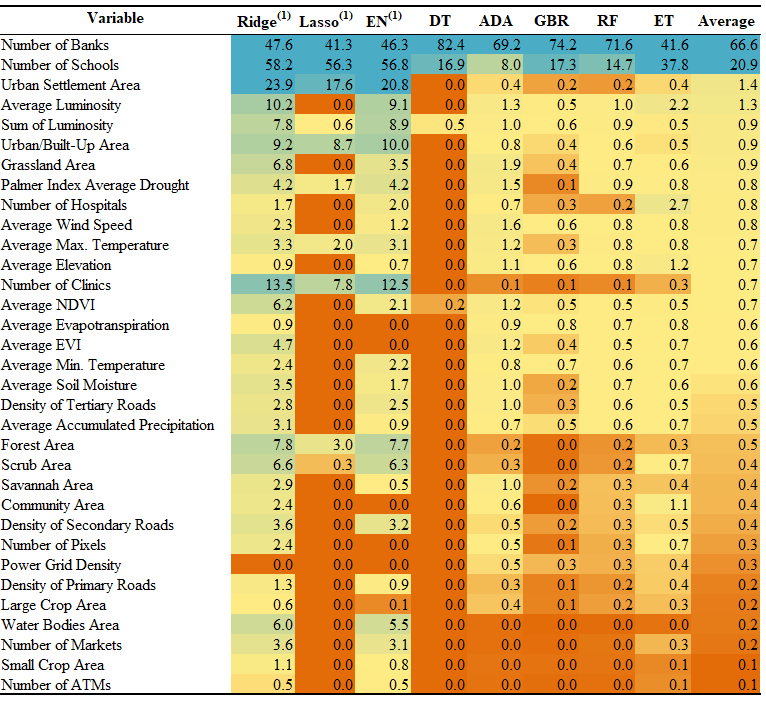
Our journey doesn’t end with algorithms; it extends into the realm of remote sensing. The study unravels the relevance of variables generated through remote sensing in predicting community-level poverty headcount ratios. Among these, the number of banks and schools in each community emerges as the most influential. These factors are closely followed by indicators such as the extent of urban settlements, built-up areas, and luminosity (Figure 2). These variables are key because they mirror access to financial services, education, infrastructure, economic activity, and population concentration —-all pivotal elements in a community’s socioeconomic well-being.
Changing Faces of Poverty: 2012 vs. 2022
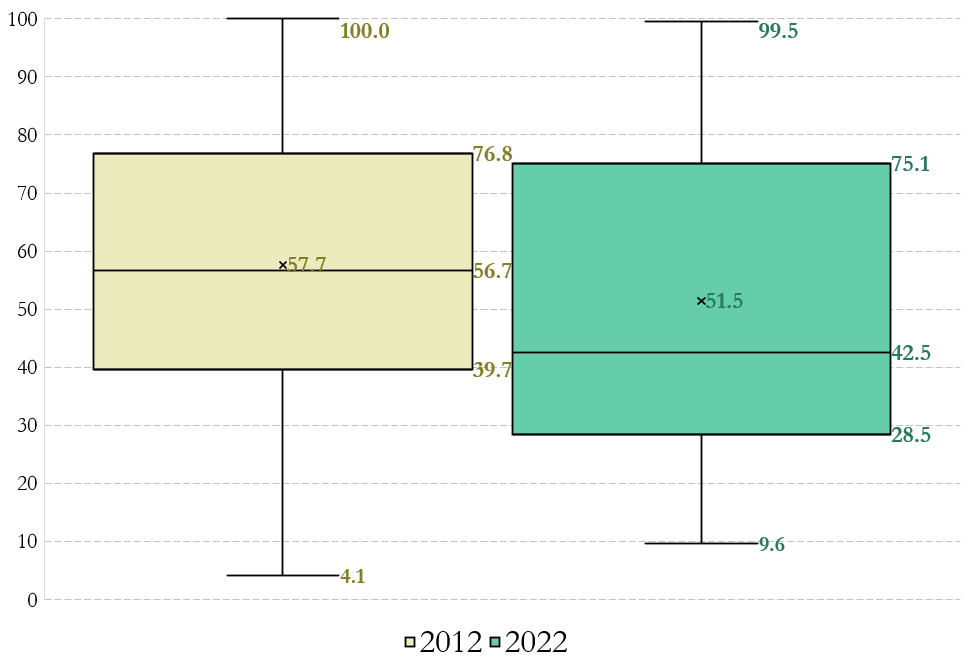
The study unfurls the shifting contours of poverty, unveiling a significant transformation between 2012 and 2022. On the whole, there’s a downward trend in the number of people living in poverty across the analyzed communities compared to 2012. However, the real standout here is that nearly 50% of these communities in 2022 would witness a UBN poverty headcount ratio below the 42.5% threshold. This marks a remarkable improvement of 14.2 percentage points from 2012, considering that the median poverty incidence based on 2012 data stood at 56.7%. Delving deeper into the projected poverty headcount ratio distribution, a considerable reduction emerges, especially in the first quartile, indicating a positive change in the socioeconomic conditions of these communities during this decade (Figure 3).
From Disparity to Development: An Intriguing Pattern
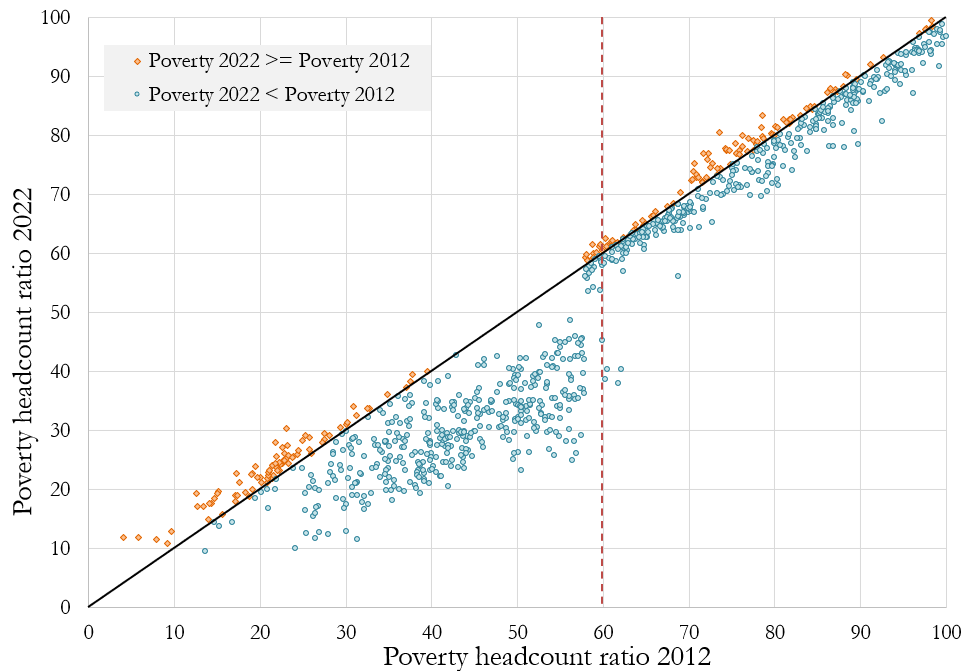
The data paints an intriguing picture of varying degrees of poverty reduction among communities, based on their initial poverty levels in 2012. What stands out is that communities starting from a lower poverty threshold in 2012 (below 60%) have seen more significant reductions in poverty incidence (Figure 4). This could be due to a threshold phenomenon, where communities with initial poverty levels below 60% have crossed a developmental threshold, fostering poverty reduction through economic opportunities and existing infrastructure. On the flip side, communities that began with higher poverty levels (60% or more) experienced more moderate reductions, likely due to deeper-rooted structural challenges demanding long-term, multifaceted interventions.
Regional Disparities and the Road Ahead
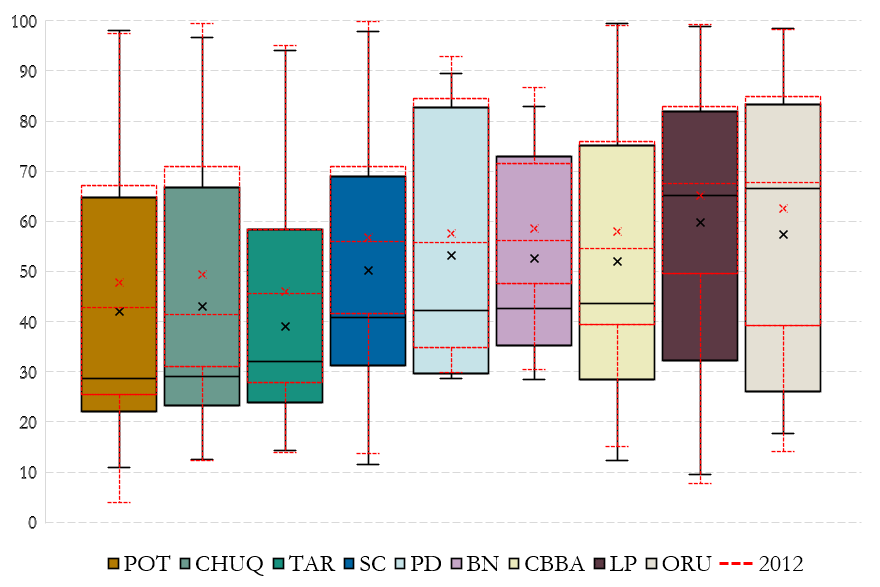
An in-depth examination also spotlights regional disparities in poverty headcount ratio reduction rates. The department of Santa Cruz emerges as a success story, displaying the most substantial decrease in median poverty headcount ratio. In contrast, departments like Oruro and La Paz show more moderate reductions, indicating structural challenges that demand tailored policies (Figure 5). A localized approach, involving collaboration between governmental bodies, NGOs, and the local community, is essential for designing and implementing strategies that address the unique needs of each department and promote equitable development.
Mapping the Path of Progress
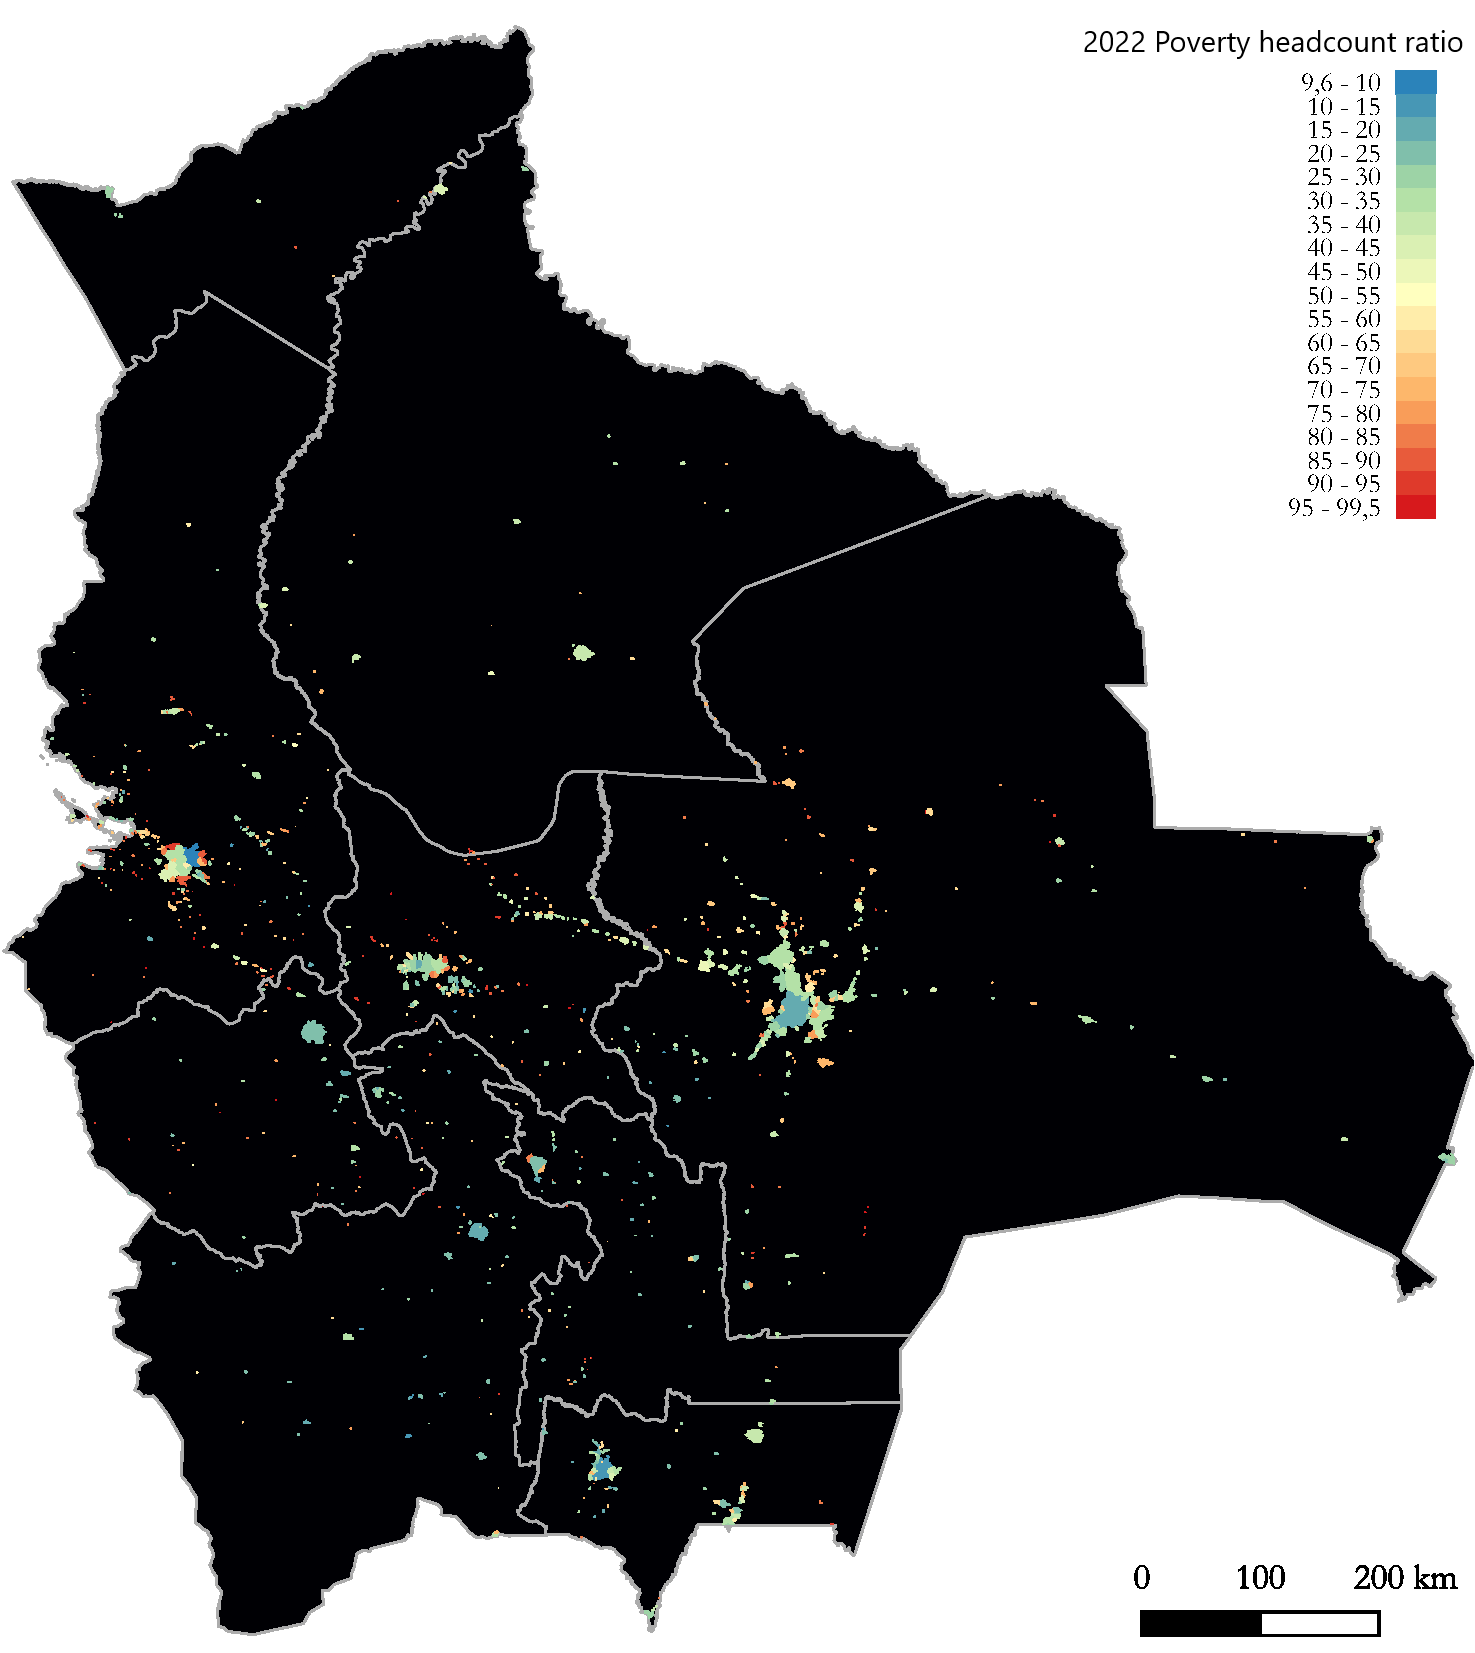
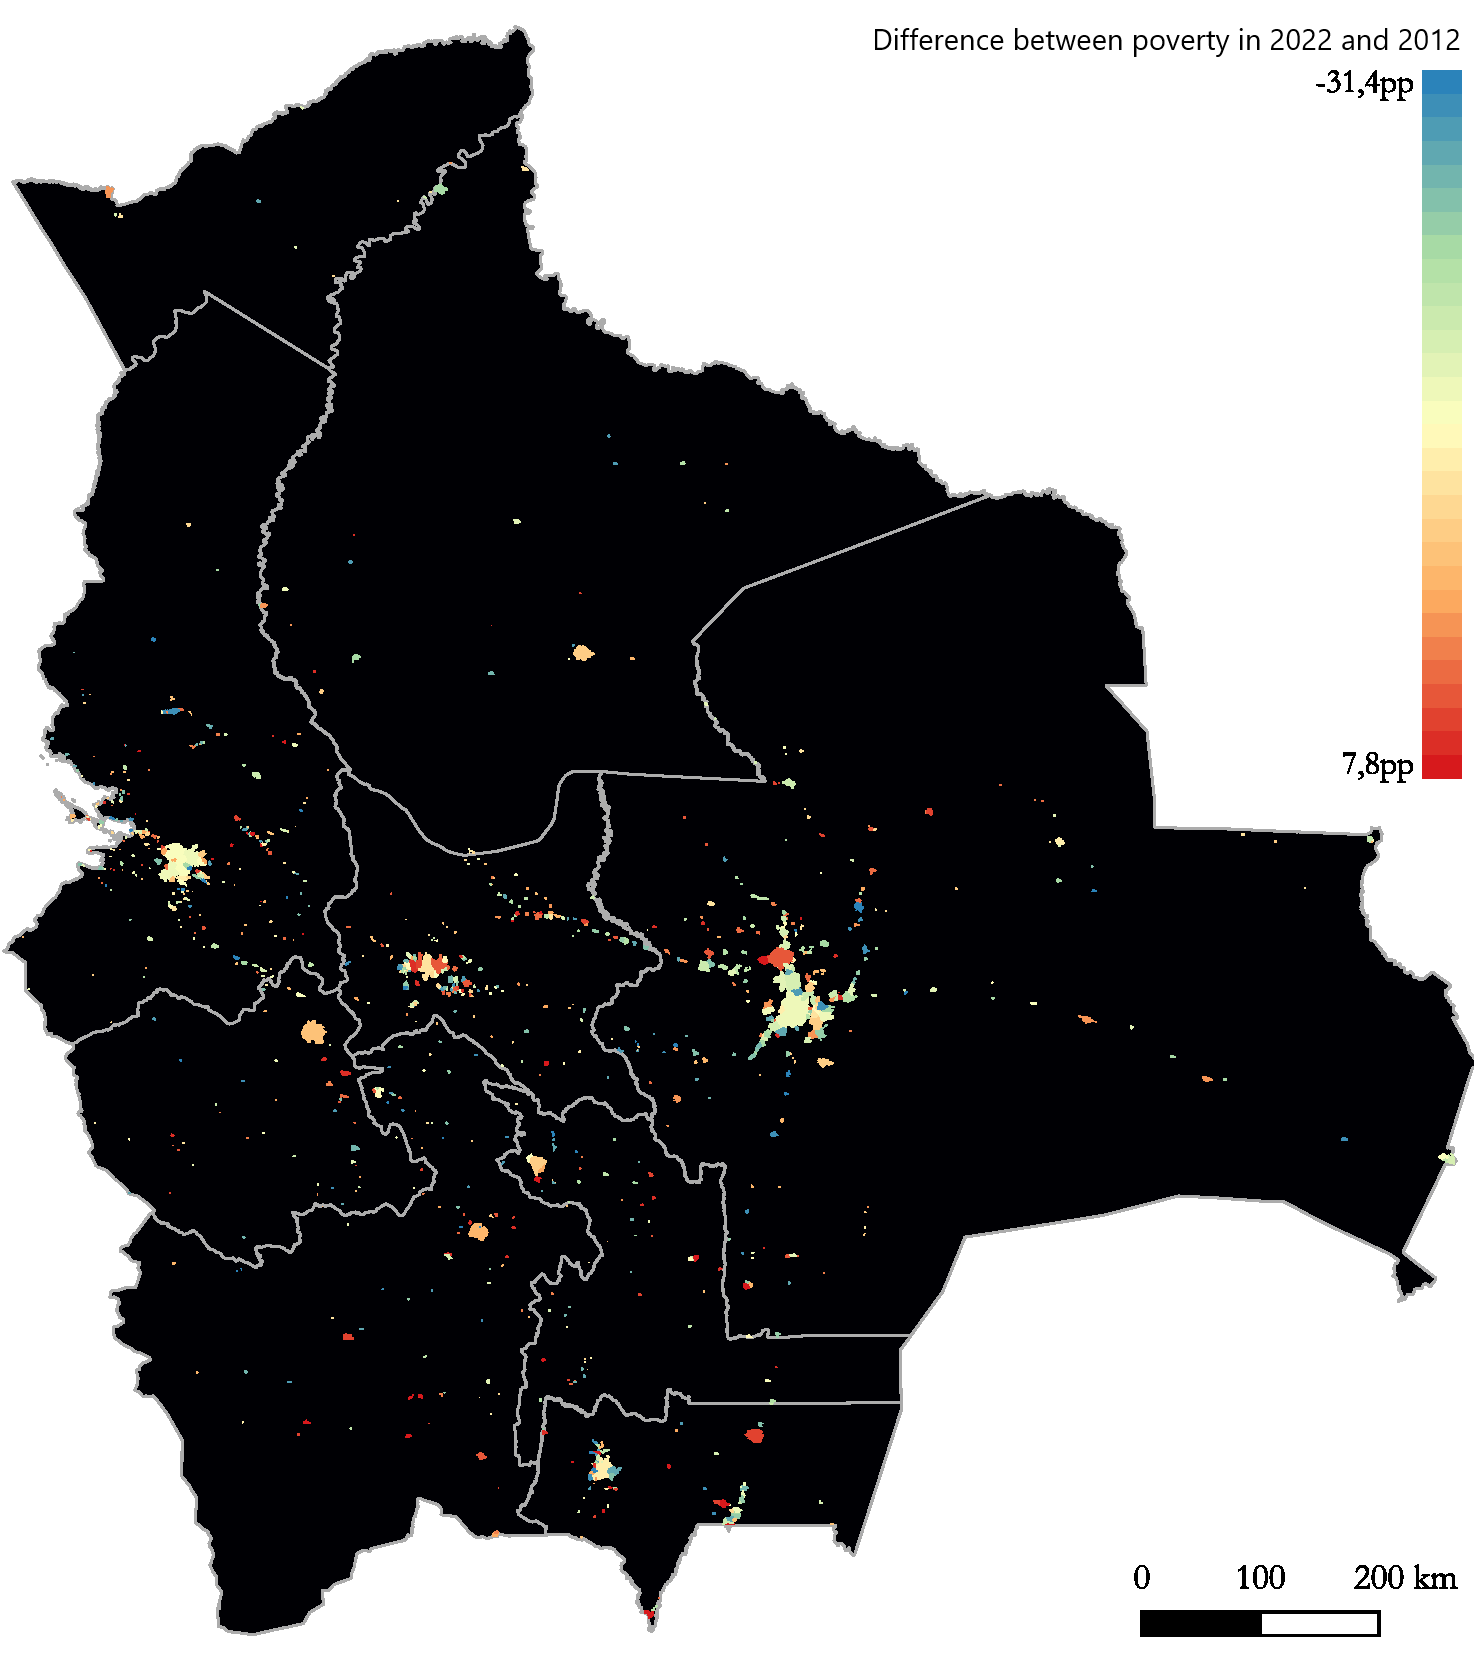
The research culminates in maps (Figures 6 and 7) that offers a detailed glimpse into the trends of poverty reduction in the 953 communities studied between 2012 and 2022. The clustering of communities with significant progress in poverty reduction near urban centers reflects the positive impact of proximity to economic hubs. However, the variations also spotlight inequalities in local resources, infrastructure investments, and quality of life. Tailored development strategies are crucial to bridge these gaps.
Urban vs. Rural: Contrasting Realities
The study’s geospatial analysis brings to light the stark contrast between urban and rural areas. Capital cities and their surroundings shine as areas with the lowest poverty rates. However, rural regions, especially highland areas and Cochabamba, grapple with higher poverty rates. The data highlights 68 communities where over 90% of the population lives in poverty, emphasizing economic and developmental disparities. The study underlines the necessity for policies targeting regional inequalities and promoting equitable development.
Guiding Lights for the Future
The study offers guiding lights for crafting a path towards sustainable poverty reduction. It emphasizes the need for comprehensive approaches that address both economic and social aspects. Investing in infrastructure, education, and healthcare services serves as the bedrock for laying the foundation for sustainable development. Training and empowerment programs are pivotal, strengthening local skills and productivity, increasing economic opportunities, and reducing vulnerability. Fostering local employment and investments is essential for rekindling economic growth. Above all, tailored policies catering to each community’s unique challenges are imperative.
A Lesson in Predictive Power
One of the most striking aspects of this research is the strength of the machine learning algorithms in predicting community-level poverty incidence. In some cases, their performance surpasses what’s been observed in previous high-profile research. This emphasizes the effectiveness of the methodology and showcases the potential of geospatial data and machine learning algorithms in predicting poverty.