Bolivia’s Built-Up Areas
Bolivia’s Built-Up Areas
Click on the image below to download Bolivia’s 2022 Built-Up Classification. Please reference as:
Bolivar (2023). Bolivia’s Built-Up Areas. https://osmarbolivar.github.io/R_built_up.html.
Bolivia, like many countries, is seeking innovative ways to stimulate economic growth, monitor urban expansion, and make informed policy decisions. One of the powerful tools in this quest is remote sensing, particularly in the classification of built-up areas. But what is built-up classification, and how can it influence economic planning and environmental management?1
The Significance of Built-Up Classification
Built-up classification involves identifying and mapping areas with high-density human development, including buildings and infrastructure. These areas are key indicators of economic activity, as they usually align with high population density and productivity. Remote sensing, a technology harnessing satellite imagery and advanced algorithms, plays a pivotal role in understanding the spatial and temporal dynamics of these built-up areas.
By analyzing built-up classification data, researchers can:
Estimate economic growth: Built-up areas are strong proxies for economic activity. By tracking changes in these regions, economists can estimate economic growth over time.
Identify areas of economic activity: Understanding where economic activities are concentrated is crucial for policymakers. It helps in directing resources and investments to regions with the most potential for growth.
Monitor urban expansion: With remote sensing, we can track how cities expand and evolve. This information is vital for city planners and policymakers focused on urban sustainability.
Additionally, remote sensing can shed light on the environmental impact of economic activities, helping identify issues like pollution and urban heat island effects.
The Global Human Settlement Layer (GHSL): A Valuable Resource
One widely recognized tool for mapping built-up areas is the Global Human Settlement Layer (GHSL). Developed by the European Commission, this high-resolution dataset offers a comprehensive view of human settlements across the globe. GHSL combines satellite imagery, census data, and other sources to provide details on built-up areas, population density, and other urban characteristics.
The GHSL is an invaluable resource, but it has a limitation. The last update available is from 2015. For researchers and policymakers seeking more up-to-date information, this gap can be a challenge. To bridge this gap, machine learning algorithms come to the rescue. These algorithms can be trained to predict built-up areas with high accuracy.
Bolivia’s Built-Up Classification: Filling the Gap.
Currently, there is no classification of built-up areas for Bolivia. Such data would be incredibly useful for predicting economic activity at a detailed geographic level. To address this gap, a Random Forest algorithm was trained using GHSL images. This algorithm classifies 1km pixels into built-up or non-built-up areas, utilizing data from the Landsat-8 satellite’s various bands and pixel-level light brightness levels.
The Random Forest (RF) model was chosen due to its effectiveness and wide applicability. It’s a well-established algorithm known for its robust performance across various domains and problems.
To train the RF model, urban clusters of low and high density were defined as built-up areas, while uninhabited and rural areas were defined as non-built-up areas. The images used for training are from the 2015 GHSL dataset, the latest available.
Evaluating Algorithm Performance
To evaluate the performance of the classifier algorithm, two key metrics are used: Accuracy (ACC) and the Matthews Correlation Coefficient (MCC). ACC measures the proportion of correct predictions made by the classifier, while MCC measures the correlation between predicted and actual labels, accounting for both true positive and true negative rates.
On the training sample, the algorithm performs exceptionally well, with ACC measuring 0.995 and MCC at 0.917. However, when tested on the validation sample, the MCC drops to 0.702, indicating potential overfitting. While this may suggest the algorithm isn’t generalizing as well to new data, it’s essential to remember that an MCC score of 0.5 or above is considered good, with 0 indicating a random classifier.
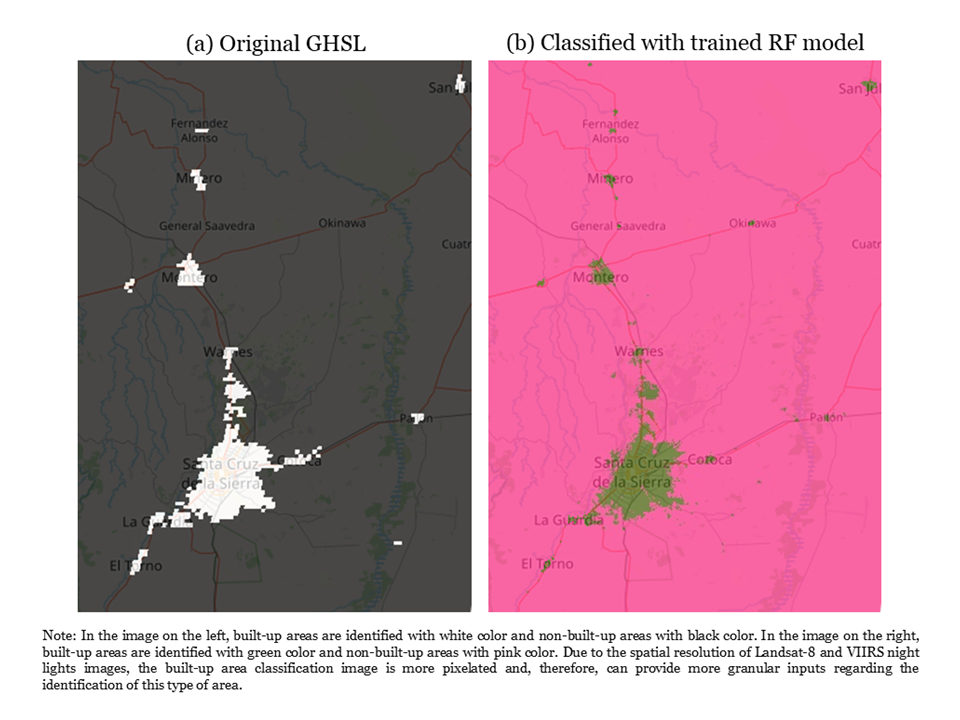
A comparison between GHSL and Random Forest classified built-up is presented in Figure 1.
Bringing Insights to Bolivia’s Economic Landscape
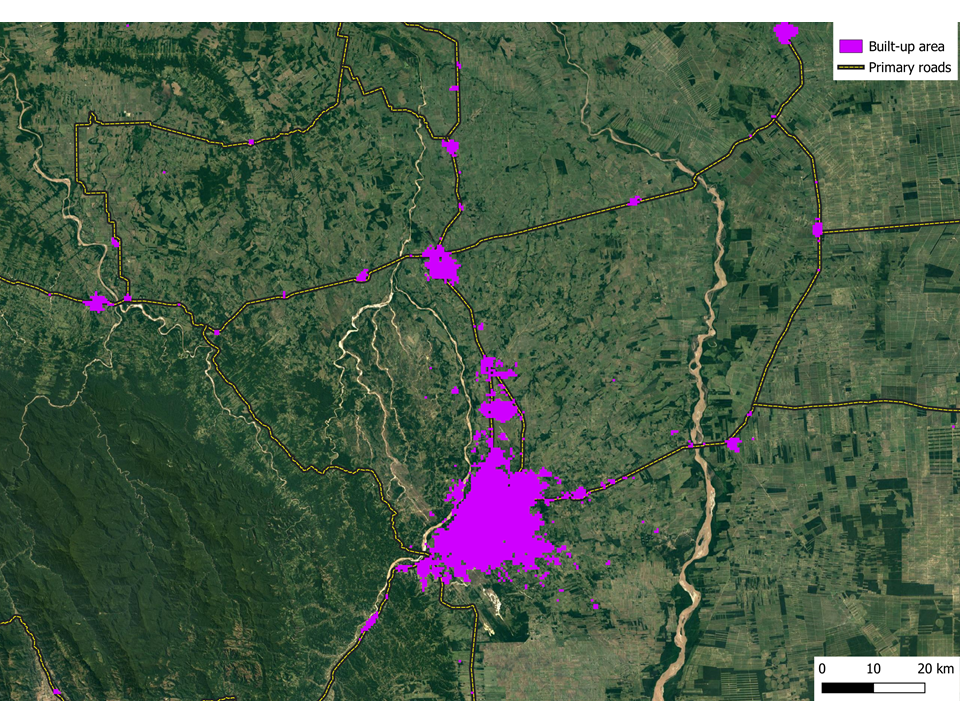
The algorithm trained using Landsat-8 and nighttime lights imagery is now being used to predict built-up areas across Bolivia at a 500-meter-pixel resolution for the year 2022. The primary aim is to provide a new level of spatial granularity for analyzing Bolivia’s economic activity.
This endeavor opens up exciting possibilities for economic planning, environmental management, and sustainable growth in Bolivia. With remote sensing and advanced algorithms, the future of economic analysis is looking brighter than ever.
The output of the Bolivia’s 2022 built-up image classification can be downloaded from this page.
The following studies were used as pivotal support for the content of this article:
- Duro, Franklin & Dubé (2012). A comparison of pixel-based and object-based image analysis with selected machine learning algorithms for the classification of agricultural landscapes using spot-5 hrg imagery. Remote sensing of environment, 118 , 259–272.
- Kussul, Lavreniuk, Skakun & Shelestov (2017). Deep learning classification of land cover and crop types using remote sensing data. IEEE Geoscience and Remote Sensing Letters, 14 (5), 778–782.
- Chicco & Jurman (2020). The advantages of the matthews correlation coefficient (mcc) over f1 score and accuracy in binary classification evaluation. BMC genomics, 21 , 1–13.
- Jiang et al. (2020). Detecting the dynamics of urban growth in africa using dmsp/ols nighttime light data. Land , 10(1), 13
- Corbane et al. (2021). Convolutional neural networks for global human settlements mapping from sentinel-2 satellite imagery. Neural Computing and Applications, 33 , 6697–6720.
- Liu, Zuo & Dong (2021). Analysis of temporal and spatial characteristics of urban expansion in Xiaonan district from 1990 to 2020 using time series landsat imagery. Remote Sensing, 13 (21), 4299.
- Zhou et al. (2021). Urban sprawl and changes in land-use efficiency in the beijing–tianjin–hebei region, China from 2000 to 2020: A spatiotemporal analysis using earth observation data. Remote Sensing, 13 (15), 2850.